Really Great Reading is an intervention program in use in Ohio school districts to help teach reading. It is tightly aligned with the Science of Reading, which is directly mentioned in Ohio’s Plan to Raise Literary Achievement, so it is popular in the State. Most schools in Ohio that subscribe to Really Great Reading use a website (GroupingMatrix) to gather and report on their data. While easy to use for teachers, the visualizations are really lacking in this program. I was contacted by a local school district to create a Really Great Reading Data Visualization.
Data Extraction
Unfortunately, the way that GroupingMatrix was set up, there is no single download of all raw data files available. Further, each different assessment has slightly different column names, number of columns, and data formats. And lastly, the files are stored as per-building, per-grade-level XLS files with multiple tabs for each assessment. Downloading the files was fairly straightforward.
Data Cleaning
As any good data consultant will tell you, projects like these are 90% data cleaning and 10% visualization. This was true in this case as well.
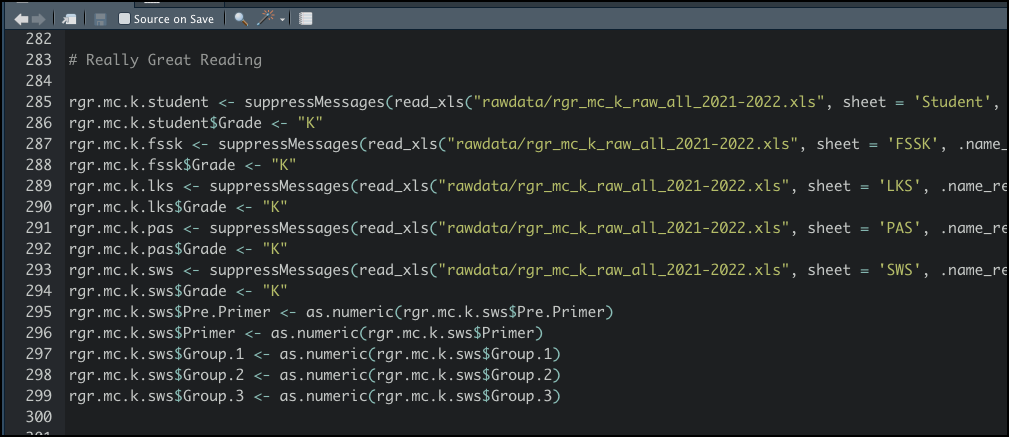
After downloading each of the XLS files, I wrote an R script to do the following:
- Separate each building-grade’s XLS files into separate data frames for each assessment
- Normalize the data field formats among similar assessment data frames
- Add missing data (Grade level, for example, to the files that only were given to one grade)
- Combine the similar assessment data frames and remove the working data frames
- Write out the data frames to CSV for use by Tableau
Why R? Couldn’t I just have used Tableau and/or Excel to do the data wrangling? Yes, probably. And “probably” is important. I have had hit-and-miss success with Tableau’s data wrangling. It’s most likely just due to inexperience, but I know for sure, 100%, that I can do whatever wrangling I need to do with R, but that using Tableau I may run into a situation where their routines won’t meet a need.
Data Visualization
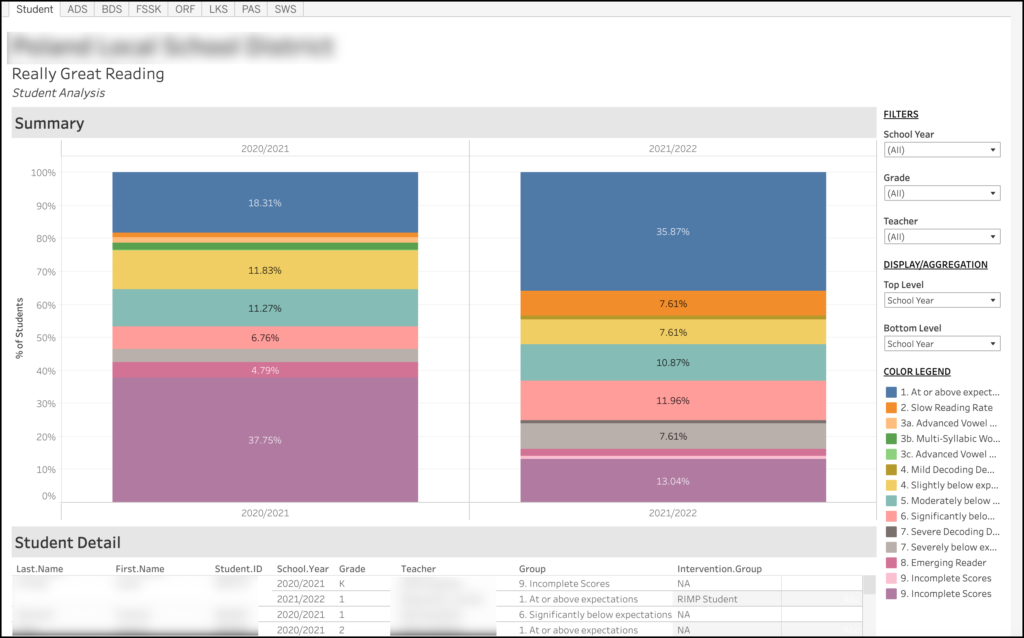
Now that I have my formatted CSV files, I can write the Tableau visualizations. Based on feedback from the district, they wanted one graph for each different assessment, which made it really straightforward. Below is a sample of the viz for the overall student performance:
Parameter-driven Disaggregations
The filters on the upper right are fairly standard. If you choose to filter just the current school year, then only that data will appear in the graph. But if you look under “DISPLAY/AGGREGATION”, you’ll see 2 boxes – one labeled “Top Level” and another labeled “Bottom Level”. This controls how the data is displayed. In the above image, I have “School Year” selected for both the top and bottom, so this just shows a general overview of the performance for each school year. If I were to select “Grade” for the “Bottom Level”, you would see individual columns for each grade in each school year. This lets you use one graph for multiple different disaggregations. Check my site for a more in-depth article on how I do this.
Dashboard Actions
Lastly, you will see “Student Detail” at the bottom. The data that appears in this section is controlled by what is selected in the top “Summary” section. If nothing is selected, then all data is displayed. If, however, you click on the blue box at the top of the 2021-2022 column (the one that is labeled “35.87%), only the students that comprise that box will be displayed below. This is a dashboard action in Tableau, and it is extremely powerful.
Summary
This is just a quick example of how I help schools visualize their data. The great part about doing something like this is that the data is structured to easily add new school years, phases (beginning, middle, end), teachers, grades, etc. This same visualization can be used next year with very minimal changes.